Valparaíso
{imagen}
Haga clic en la imagen para activar la animación
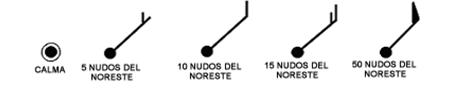
La imagen para la bahía de Valparaíso, muestra una animación de mapas de viento a 10 metros de altura, proyectados a 96 horas e intervalos cada 1 hora. La modelación se realiza con WRF a una resolución de 3 kilómetros y graficados con la herramienta GrADS. Los colores representan variaciones en intensidad del viento cada 5 nudos y son acompañados con el gráfico de barbas del viento, señalando la dirección e intensidad se acuerdo a siguiente figura:
Puerto Montt
{imagen}
Haga clic en la imagen para activar la animación
La imagen para Puerto Montt e Isla de Chiloé muestra una animación de mapas de viento a 10 metros de altura, proyectados a 96 horas e intervalos cada 1 hora. La modelación se realiza con WRF a una resolución de 3 kilómetros y graficados con la herramienta GrADS. Los colores representan variaciones en intensidad del viento cada 5 nudos y son acompañados con el gráfico de barbas del viento, señalando la dirección e intensidad se acuerdo a siguiente figura:
Estrecho de Magallanes
{imagen}
Haga clic en la imagen para activar la animación
La imagen para Puerto Montt e Isla de Chiloé muestra una animación de mapas de viento a 10 metros de altura, proyectados a 96 horas e intervalos cada 1 hora. La modelación se realiza con WRF a una resolución de 3 kilómetros y graficados con la herramienta GrADS. Los colores representan variaciones en intensidad del viento cada 5 nudos y son acompañados con el gráfico de barbas del viento, señalando la dirección e intensidad se acuerdo a siguiente figura:
Valparaiso
{image}
Clic on the picture to activate the animation
The image for the Valparaíso bay shows a 10-meter-height wind animated map, out to 96 hours, and every 1 hour. Modeling is made with WRF, with a resolution of 3 kilometers, and illustrated using the GrADS tool. Colors represent variations in the wind intensity every 5 knots, and go together with wind barbs showing the direction and intensity, according to the figure below:
Puerto Montt
{image}
Clic on the picture to activate the animation
The image for Puerto Montt and Chiloé Island shows a 10-meter-height wind animated map, out to 96 hours, and every 1 hour. Modeling is made with WRF, with a resolution of 3 kilometers, and illustrated using the GrADS tool. Colors represent variations in the wind intensity every 5 knots, and go together with wind barbs showing the direction and intensity, according to the figure below:
:
Magellan Strait
{image}
Clic on the picture to activate the animation
The image for the Magellan Strait shows a 10-meter-height wind animated map, out to 96 hours, and every 1 hour. Modeling is made with WRF, with a resolution of 3 kilometers, and illustrated using the GrADS tool. Colors represent variations in the wind intensity every 5 knots, and go together with wind barbs showing the direction and intensity, according to the figure below: